I don’t recall what convinced me to attend. Spending an evening listening to a physicist talk about prosperity doesn’t sound like my idea of fun. And yet, there I was, on a cold Wellington evening in 2011. I rushed up the stairs at Te Papa, and quietly grabbed a seat near the back of the theatre just as the speaker was introduced.
“Tēnā koutou,” he said tentatively, conscious about his vowels.
“Ko Paul Callaghan toku ingoa”
“We don’t think very well about the future in New Zealand”
He had me at hello!
In the years since then his short talk has had an outsized impact on New Zealand. Only a small group of people attended in person and only slightly more than that have ever watched it online. But a much larger audience has enthusiastically adopted his memorable suggestions, and they’ve shaped public policy significantly (although perhaps not at all in the way he intended).
You may be surprised to discover exactly what Callaghan actually proposed back then.
His primary concern was our place in the world. He showed that New Zealanders work longer and harder than just about anybody, but earn less per hour than nearly all other countries we compare ourselves to. This was true then and it’s still true today.
This was a very personal point for Callaghan. By 2011 he had already been diagnosed with cancer. He explained that prosperity is what allows us to afford the things we all want more of, like new drugs, better hospitals and skilled people to work in them.
His prescription was simply stated. He said we needed more companies that generate high revenue per employee (unlike tourism), and without negative environmental impacts (unlike dairy farming).
He counted the revenue earned by the largest software and manufacturing companies that existed at the time and extrapolated. He suggested we needed a hundred more like them.
He identified that creating and sustaining these companies would depend on highly skilled and highly sought-after people. If we wanted to attract and retain them, New Zealand would need to be a place where talented people choose to live and work.
Remarkably, given the things we’ve subsequently applied his name to, he explicitly warned against picking favourites.1 He said that these businesses would be unpredictable. He anticipated that our competitive advantage would be in obscure niches, and that the companies that were eventually successful would surprise us.
He was right about all of those things.
I encourage you to watch the recording of the talk. It’s just over 20 minutes long. There are parts of it that have aged quite significantly, but most of it feels just as relevant today as it was in 2011.2
Callaghan shared some big ideas that night. For me, the biggest lesson was his style of presentation, which I assume reflected his style of thinking.
He described our common beliefs, exposed the flaws and (importantly) in each case proposed a different, better way of thinking. He didn’t just give the correct answer (from his perspective, at least); he explained why previous assumptions were wrong.
With that in mind, let’s revisit the seven common myths that he spoke about with the assistance of the latest data and the benefit of hindsight, and think about how his message might have been updated, if he were still with us to do that…
1. New Zealand is an egalitarian society
This is something that we still like to believe, although I feel that we’re now a little more honest about our current reality.
Callaghan quoted OECD income inequality data, calculated using the Gini Coefficient, where higher values indicate higher inequality.
In 2010 the value for New Zealand was 0.32. In 2011 (the data he used in his presentation) the value was 0.35, which ranked us 26th out of the 33 “rich” countries.3
In 2020 the value was still 0.32 - so there wasn’t any material change during that decade.4 If you go back further, we have been in that same range ever since 1992.5
As for international comparisons, the most recent OECD data ranks us 23rd out of 37 countries, slightly behind Greece and Portugal.6
In other words, despite what we think, nearly all the other countries that we like to compare ourselves with are still more egalitarian than us.
2. New Zealand is “clean and green”
When Callaghan was speaking in 2011, there was a lot of discussion about the validity of the “100% Pure” message used by Tourism NZ, and how much economic output contributes to that.7
John Key, who was Prime Minister at the time, would later say that the expression 100% Pure was “like a fast food ad” and “should be taken with a pinch of salt”.8
The specific example Callaghan referenced to describe this myth was the impact on water quality from increased dairy farming.
I wonder what he might have said then if he had known that by 2020 the output from dairy farming would increase by a further 22% (from 17,339 million litres of milk to 21,145 million litres).9
He also referenced this graph, to highlight the hypocrisy of expecting other developing countries to be more respectful of their environmental impact now, when our own history in this regard is poor, especially from 1800 onwards:
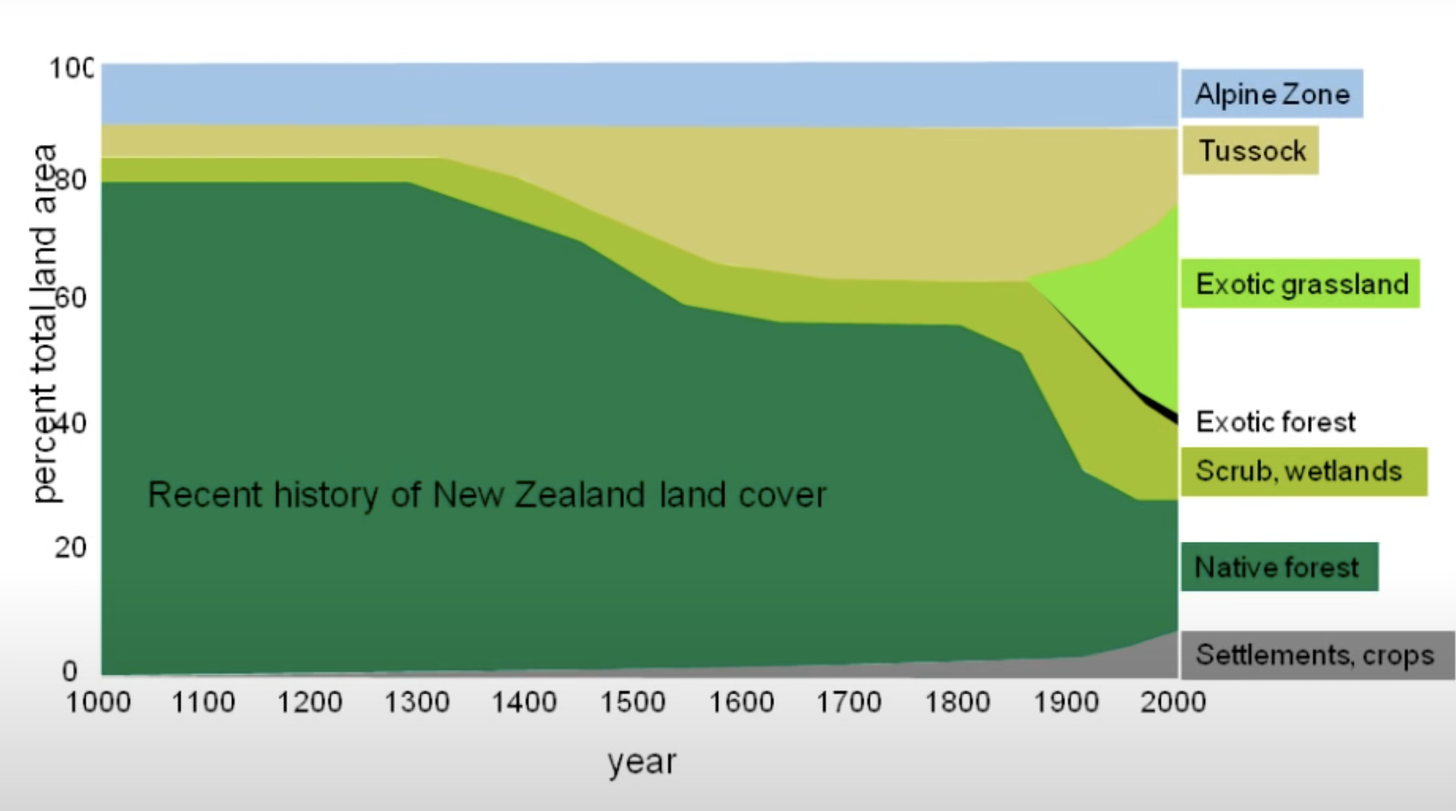
That still feels very topical today, although the media focus has now shifted away from our marketing messages and more towards our actual response to climate change.
3. We don’t need to be more prosperous
Callaghan mocked people who were dismissive of our declining prosperity:
We don’t need to be rich like those Australians
He explained that prosperity is what allows us to fund the things we all want more of - better schools, hospitals, roads and connections to the rest of the world. And many other things.
He specifically focussed on the income gap with Australia. In New Zealand we love a flattering per capita measure of success. Unfortunately, this is not one of them!
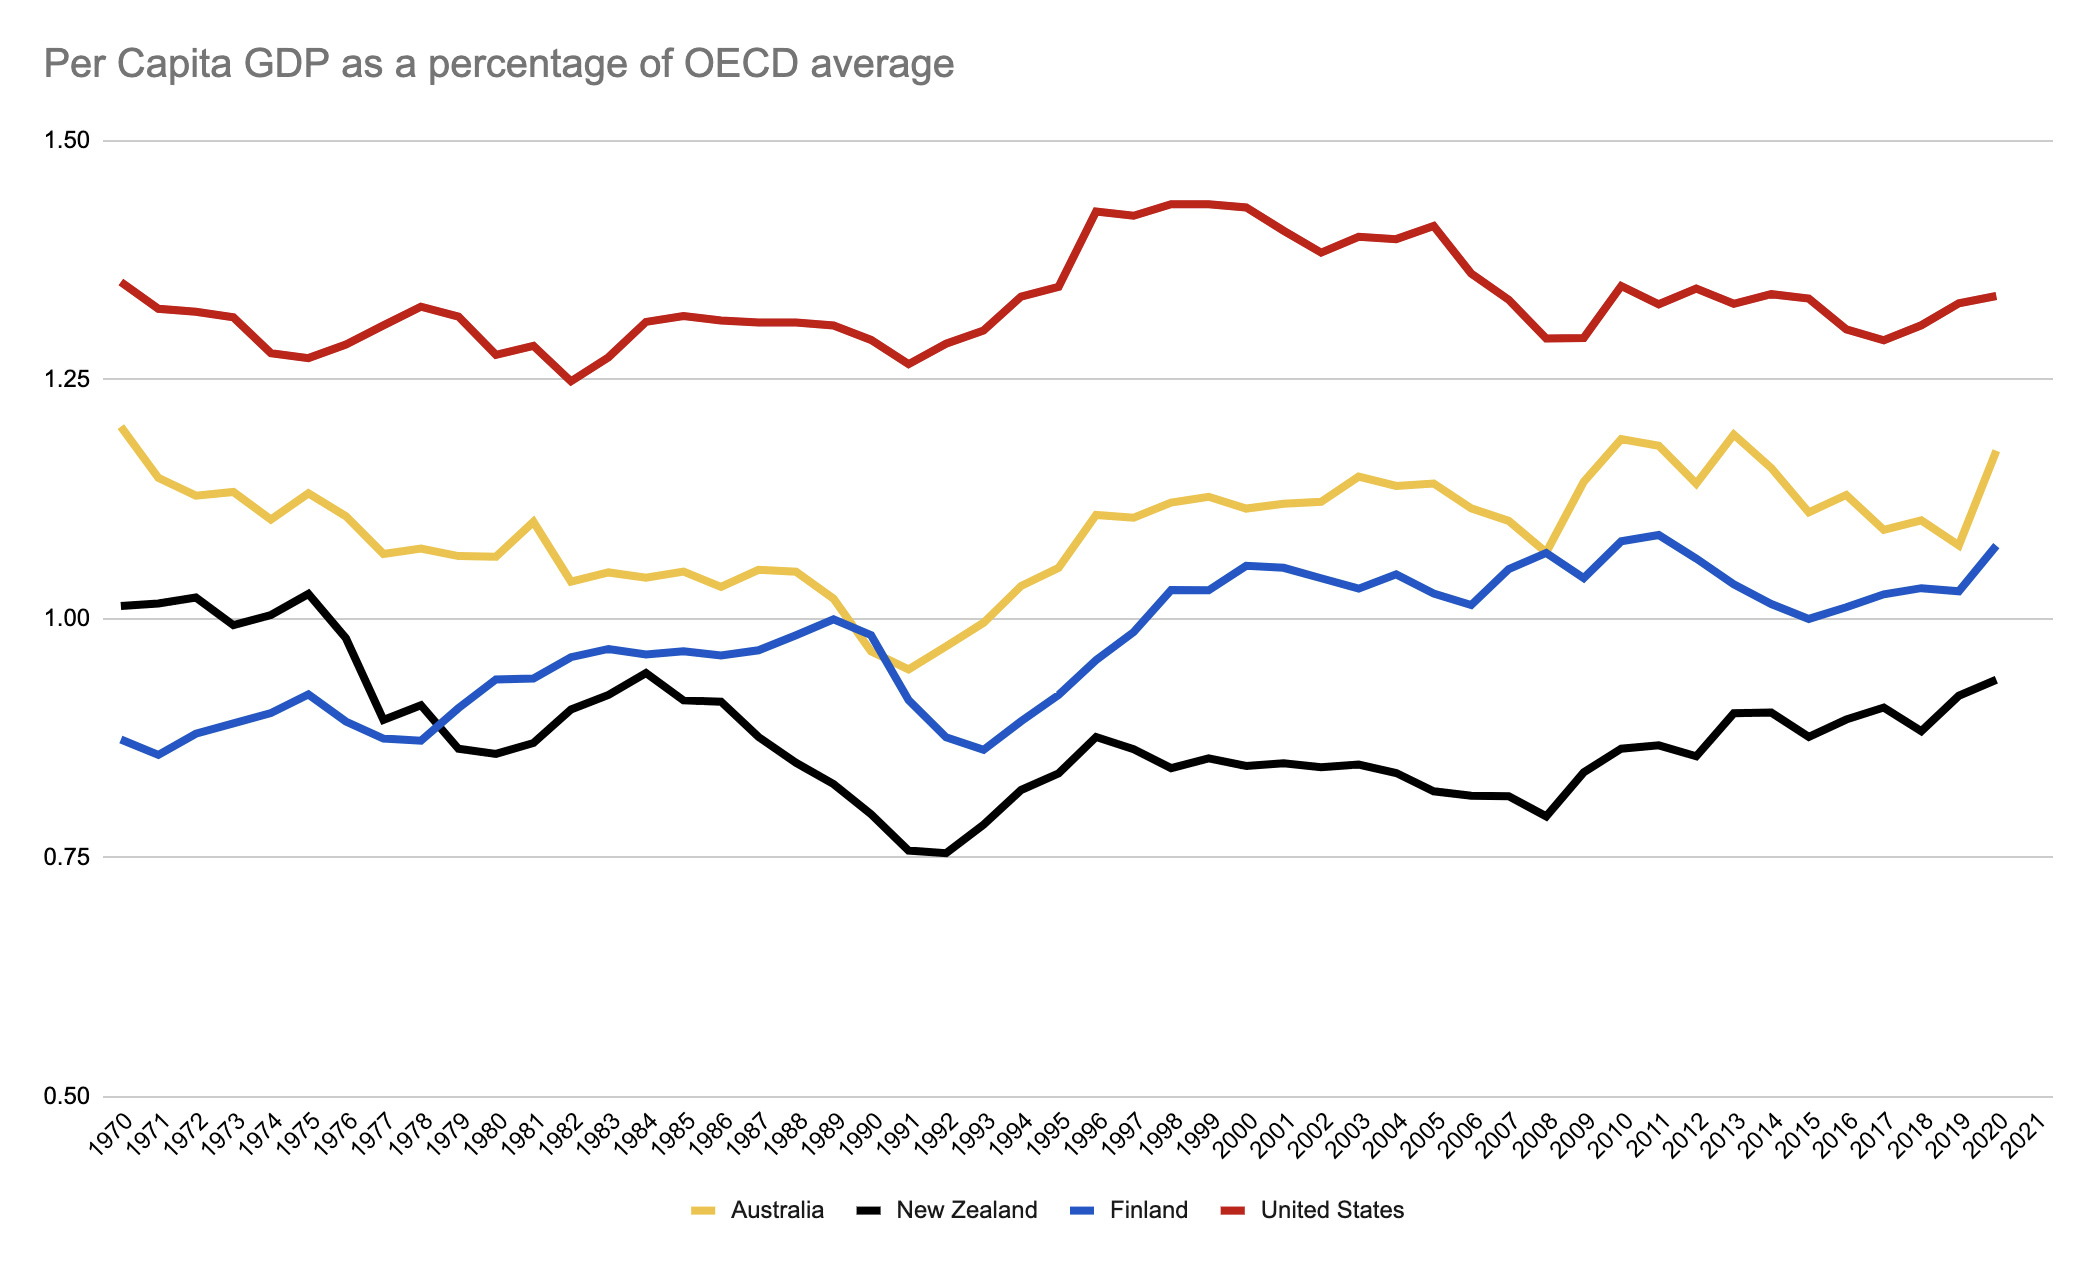
I was born in 1976, which is the last time that New Zealanders earned more per capita than the OECD average. By 1992 we had fallen to only 75% of the OECD average. The gap with Australia at this point was already over 20%. Since then we have struggled to catch up - both countries have improved relative to the OECD average in recent years, but that is partly a result of new countries that have joined the group and impacted the underlying average (for example, Chile, Estonia & Slovenia in 2010, Latvia in 2016 & Colombia in 2020).
In 2010, Callaghan calculated that to match the prosperity of Australia, New Zealand would need to earn NZ$45 billion more per year. This may have been an underestimate.10
What’s happened since then?
In 2020 Australia earned A$80,436 per capita (~117% of OECD average) while the equivalent value in New Zealand was NZ$63,613 per capita (~93% of OECD average). That means the gap has grown to NZ$21,750 per capita or NZ$112 billion in total.11
However we calculate it, the gap continues to be substantial.
Callaghan was speaking in the wake of the Christchurch earthquakes, and he specifically highlighted the predicted cost of the rebuild as “severe”. It’s chilling to think that the government portion of that rebuild was $7 billion, compared to the $50 billion the government allocated in 2020 towards the COVID-19 response and the $42 billion earmarked for new infrastructure spending in the four years after that.
There is a lot of work to do!
4. We have a relaxed easy-going lifestyle
(a.k.a, to be more prosperous we’d need to work harder)
This is the most confronting statement Callaghan makes in this talk:
We are poor because we choose to be poor
What did he mean? We choose to own and work in businesses that require long hours for little output per hour worked:
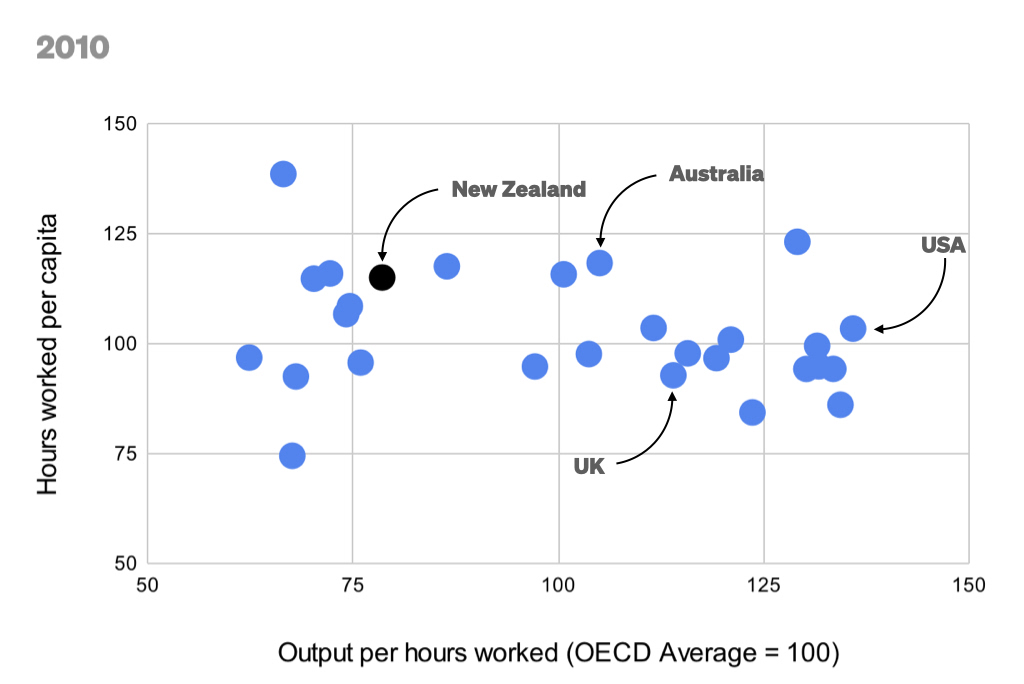
Note: I’ve updated this based on the most recent OECD Data to show the full OCED group of countries.
He showed we worked longer than just about anybody, but earned less per hour than nearly all the other developed countries that we compare ourselves to.
Again, what has happened since then?
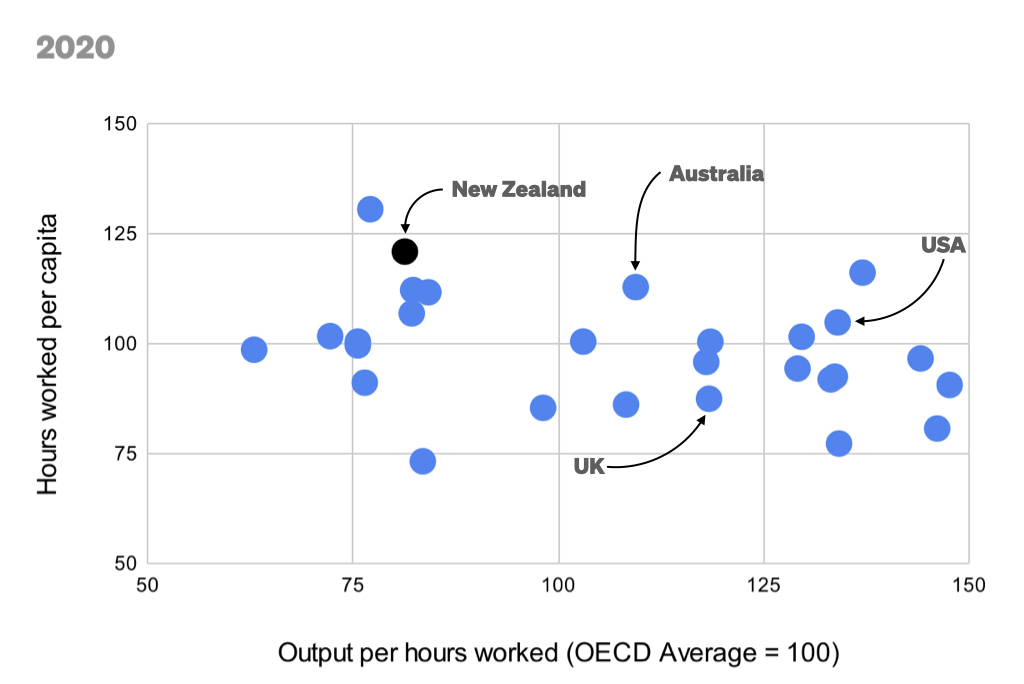
Sadly there has been no improvement.
In fact, we now work even harder than we did then, and with only a marginal improvement in output per hour.
We are still poor because we choose to be poor.
5. More tourism would benefit the economy
Next, Callaghan broke it down by sector, to attempt to understand the component parts.
To do this he calculates the revenue per employee required to maintain then current levels of GDP, and comes up with $120,000 per job (or, more accurately per full-time equivalent employee).12
He compared that average to the values for the two biggest sectors:
- Tourism: $80,000 per FTE
- Dairy: $350,000 per FTE
The two lessons he drew from this still feel very contemporary:
Firstly, it’s a mistake to think that we could grow more prosperous on the back of more tourism. This is because each additional job in this sector, as it’s currently configured, drags the overall average down. If we target only high value tourism jobs, as is often proposed, there are by definition likely to be significantly fewer jobs and so it would have less impact on overall numbers.
Secondly, we need to be careful before we dump too hard on the rural sector in general and dairy specifically. As he said:
If it weren’t for Fonterra we’d be desperately poor.
This point in particular is often missed by people who want to encourage growth in the “tech” sector. He wasn’t suggesting we needed to replace jobs in tourism or agriculture with technology jobs, but that we need to create new businesses in addition to those existing sectors.
When I re-calculate Callaghan’s 2010 values using current OECD data I get a revenue per FTE value of $110,500 (slightly lower than his $120,000). My equivalent value for 2020 is $144,400 (a 12% increase in real terms).13 In either case, that 2020 value is a good benchmark for each of us to consider when reflecting on our own payroll - are we dragging the average up or down?
As an example, it is interesting to consider revenue per FTE for Xero, which back in 2011 wasn’t on the radar at all but is now a case study:
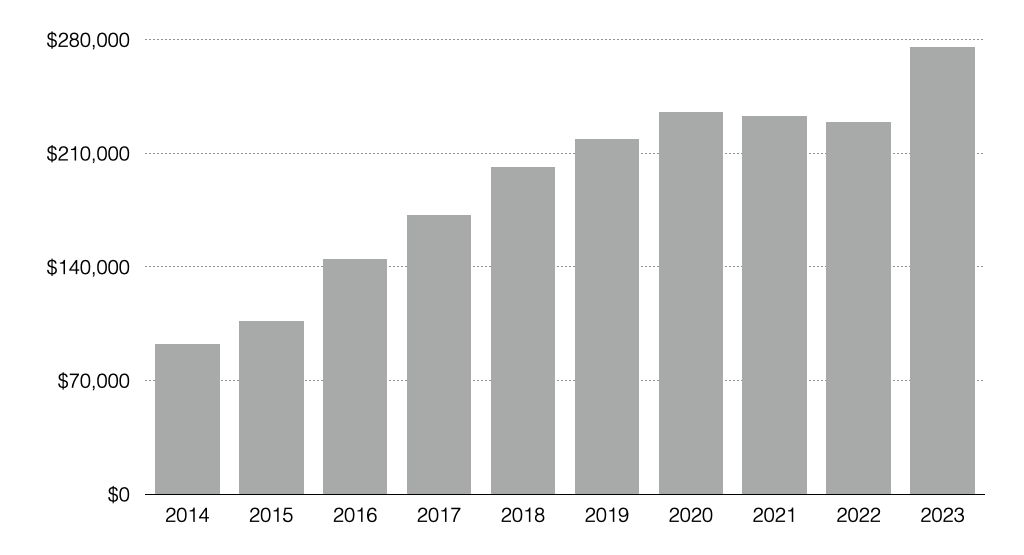
In FY23 Xero reported revenue of $275,500 per FTE. This value increased every year between 2007 and 2020, and has been improving the national average ever since 2015.
6. You can’t manufacture in New Zealand
Back in 2011 the most successful local “tech” companies were nearly all manufacturers: F&P Healthcare, Rakon, Tait Electronics, Gallagher. Even Callaghan’s own company, Magritek.
So thinking about the contribution that manufacturing, and specifically ELT manufacturing (meaning elaborately transformed goods) could make was logical.
As Callaghan explained, the goal is to make products with high profit margins and high value per weight, which would require a significant investment in Research & Development (R&D). Not surprisingly this has become a big focus for Callaghan Innovation and the government generally in recent years.
He said:
We own the sort of businesses that don’t need much R&D
Unfortunately the progress we’ve made since once again doesn’t make great reading:
- 2010: 1.25% of GDP, vs. OECD average of 2.24%
- 2020: 1.40% of GDP, vs. OECD average of 2.67%
We’ve fallen further behind.
7. We are small so we need to specialise
The instinct to pick winners is seemingly timeless.
As Callaghan explained, trying to anticipate the specific types of businesses that are likely to be successful is much more difficult than it seems on the surface. This is because building a successful business is not just about an innovative idea, it’s mostly about execution.
To re-use his ten-year-old examples, while it might seem that we should have competitive advantages in biotech or cleantech, the large amounts invested in those areas from the top down have had little impact. Instead he predicted:
We better be prepared to be good at some pretty weird stuff.
Where have our successes since then actually come from?
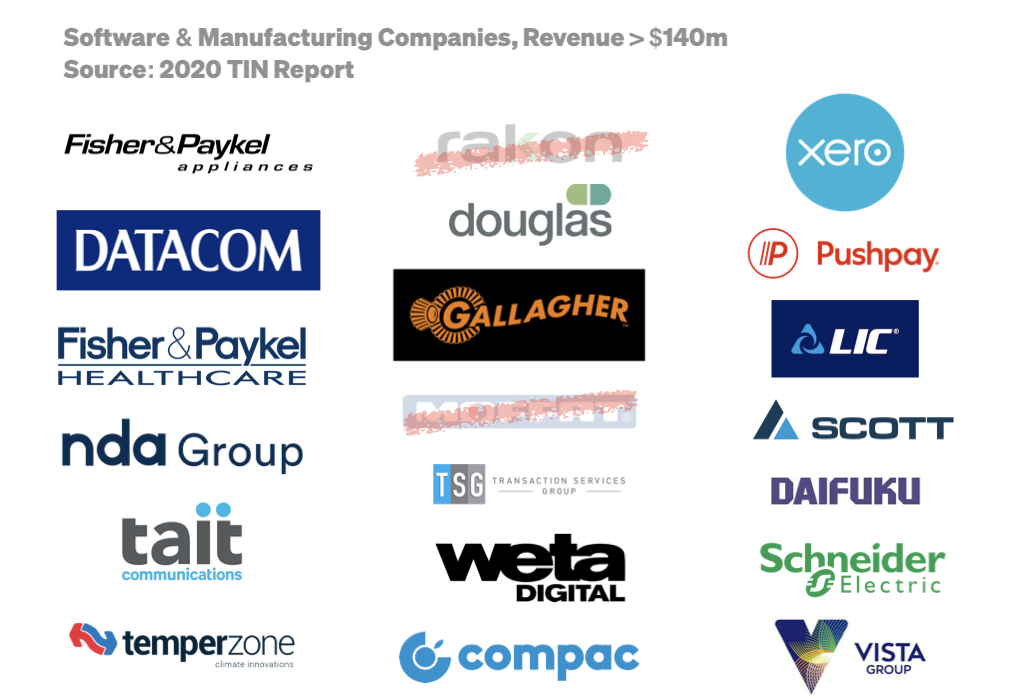
He highlighted the top ten exporters from the 2010 Technology Investment Network Report (TIN).14 Together those ten companies generated $3.9 billion of revenue per year. The top three, F&P Appliances, Datacom and F&P Healthcare, accounted for nearly 60% of that amount.
His proposal was simple in theory: to generate the additional $45 billion needed to close the gap with Australia we needed 100 more companies of that size (actually 115 additional companies, for a total of 125 companies, but let’s not get distracted by detailed maths).
How much progress have we made towards this target?
By 2020 TIN listed 18 companies that were at least as large as the 10th largest from 2010:15
- Eight companies that remained in the top 10 (although two of these, NDA Group and Tait Communications, reported reduced revenues compared to 2010); plus
- Five companies that moved up from further down the list in 2010, who had grown revenues sufficiently; plus
- Five newbies, including Xero and PushPay as well as Livestock Improvement Corporation, founded 1909,16 and Transaction Services Group, apparently founded ~200117 (it’s not clear why those two weren’t on the 2010 list?)
That’s a net increase of just eight companies.
Together those 18 companies contributed additional revenue of $3.53 billion. That means in a decade we got less than 10% of the way towards Callaghan’s original target.
This trend is even more depressing, if we consider that the very first TIN Report in 2005 contained 13 companies with reported revenue greater than $100 million. This increased to 17 companies by 2010 and to 25 companies by 2020. So even over that longer time period the growth of new companies in that bracket has been anaemic.
We’ll talk more about some of the problems with TIN - how the data is collected and reported, which companies are included, and who can access the results. Putting that aside for the moment, and reflecting on Callaghan’s conclusions that were based on this data, I believe he got some important things wrong:
Firstly, when we look at the companies that have grown the most in the years since he spoke, many are software companies. When we think about manufacturing we’re looking for exports that are higher volume by weight, and thinking about the expensive R&D that is typically required to develop those types of businesses. Where do software companies fit in - with technology that is often low-tech, but with potential that has been proven multiple times now to generate a lot of weightless export revenue? Of course, this should be a “yes, and …” not a “yes, but …”
Secondly, the results further down the list have been much more impressive. In 2010 the 100th biggest company listed was Triodent with revenues of $12 million. In 2020 the 100th biggest company was Modica Group with nearly twice that much revenue ($21.2 million). In 2010 there were 51 companies listed with more than $30 million revenue. By 2020 that number had increased to 79 companies (a 55% increase). Maybe, rather than a small number of very large companies, the “weird stuff” we are good at is going to produce a much larger number of smaller companies.
Which leads to a bigger mistake in his prescription.
Towards the end of the talk Callaghan references the average size of the largest companies, and says:
I believe that just a hundred inspired entrepreneurs could turn this country around. It only takes one genius entrepreneur to make a company like this. So a hundred individuals could earn us $40 billion a year in exports.
Reflecting his own myth busting approach back at him… this idea of a lone genius is a common misconception.
We’re actually not a small country, but we are a very lightly populated country. Because we don’t have the number of people with the skills we require to be competitive, people-lite solutions like this will always look attractive.
It’s a typically Kiwi attitude to put innovators and inventors on a pedestal (and to talk about #8 wire and claim to be punching above our weight). It’s tempting to believe that one person does it by themselves, just as we like to believe that New Zealand is clean and green or that to be more prosperous we’d just need to work harder.
But it takes much more than one crazy individual to create an enduring high-growth company.
It’s true that there is often just a single name attached to each of the businesses that becomes big enough to get our attention. Trade Me is Sam Morgan, Xero is Rod Drury, My Food Bag is Cecilia Robinson etc. And this same small group of visible founders get the bulk of the headlines. As soon as we scratch the surface of any of these companies we find that they were built by a large team of people, with a wide range of skills and specialities, all working together.
Further down the curve there are many other founders, under the radar, who have created significant smaller businesses, each with their own teams. Often the first we hear of these are when the business is sold.
Those founders all need to hire hundreds of qualified people. We don’t only need 100 founders. We need 10,000 people contributing their expertise to these businesses. Then 100,000 more.
What are the constraints to that?
Callaghan correctly identified that skilled people would be the most significant thing stopping us from creating and sustaining these companies. To attract and retain them, he said, New Zealand would need to…
Be the place where talent wants to live.
This idea has been very popular ever since. Part of the reason, I think, is that many of us just assumed it was already true, so there was nothing more we needed to do. And yet, today our growth companies are desperately short of the people they need.
I wish he’d phrased it differently.
Firstly, people are not talent. People have talents.
Secondly, it’s not enough to just have skilled people live here. We can’t just be the place where people who have already been successful come to retire or escape from the world. We need people who are still hungry for success to work here.
Finally, we never connect the dots between these skilled people and our collective prosperity. Successful companies can create a huge amount of value for the individuals who invest in them and work on them. But we never explain how that value flows also to everybody.
It doesn’t roll off the tongue quite so easily but a revised version might be:
Be the place where people who contribute more than they take want to live and work.
Even then, what does that mean?
Why will these people choose New Zealand? We need to understand and describe our competitive advantage. It needs to be much more specific than “100% Pure”.
The unimaginable future
Go back to the very first statement Callaghan makes in his keynote:
We don’t think very well about the future
The thing about the future is it’s happening constantly. The future he imagined years ago is what we now call the present. At the same time, these are the good old days we will look back on fondly in years to come.
In March 2012, just a few months after I saw him speak, Callaghan died of cancer. The biggest mistake we can make today, when we consider his legacy, is to just repeat his mantras without understanding that if he were still here now his thinking would have developed and evolved, based on the results that have been achieved and the lessons learned in the process.
I imagine he would be delighted but not surprised that the biggest successes so far were all somewhat unpredictable, even as recently as 2011. And he would warn us that future successes are likely to be just as unexpected.
The question is:
How do we build on the ideas he shared, and update them for our current reality?
Sources
Data referenced here was correct as at September 2022.
I’m grateful for the following organisations for the data sources which help to shine a light on the questions I’m asking:
Notably, the only data set I’ve relied on which isn’t freely available is the TIN Report. The 2020 version of this report cost me $399+GST. For that I got a link and password to access a digital copy of the report, which I couldn’t even download to use offline. NZTE and other government organisations have funded this report extensively over the years.
-
Callaghan Innovation was established as a Crown Entity in 2013. ↩︎
-
Sustainable Economic Growth For New Zealand: An Optimistic Myth Busting Approach, StrategyNZ workshop, 2010.
The lecture I attended in 2011 was part of a series of events around the country organised by the Royal Society of New Zealand, shortly after he was named Kiwibank New Zealander of the Year and by then the title had been updated to be much more direct in its’ aspiration:
↩︎ -
This analysis could be repeated using wealth as the measure rather than incomes. The OECD Gini Coefficient numbers are calculated excluding housing costs. ↩︎
-
Household income and housing-cost statistics: Year ended June 2020, Stats NZ, 16th February 2021. ↩︎
-
The truth about inequality in New Zealand by Andy Fyers, Stuff, 17th January 2017. ↩︎
-
Income inequality, OECD. ↩︎
-
It’s not easy seeming green, The Economist, 23rd March 2010. ↩︎
-
100% Pure Fantasy? Living up to our brand by Matt Stewart, Stuff, 1st December 2012. ↩︎
-
Dairy statistics, LIC. ↩︎
-
The difference between per capita income in New Zealand and Australia in 2010, using current OECD data was ~32% (so a bit lower than Callaghan’s figure of 35%). The OECD average GDP per capita in 2010 was US$11,674 per capita, which suggests the gap back then was more like US$51 billion - significantly more than Callaghan’s estimate of US$35 billion. ↩︎
-
This gap is calculated using the most recent OECD data, but this time using the Local Currency, Current Prices measures. ↩︎
-
This is a simple calculation, using his numbers: GDP per capita = ~$40,000, Population = 3.9 million, FTEs = 1.3 million, so each of those 1.3 million FTEs needs to earn ~$120,000 to get to a GDP per capita value of $40,000 across the whole population. ↩︎
-
Callaghan, Revisited Calculations, Google Spreadsheets. ↩︎
-
The top ten exporters from the 2010 TIN Report (revenues as reported):
- F&P Appliances ($1.1 billion)
- Datacom ($667 million)
- F&P Healthcare ($503 million)
- NDA ($200 million)
- Tait Electronics ($200 million)
- Temperzone ($163 million)
- Gallagher ($160 million)
- Douglas Pharmaceuticals ($145 million)
- Rakon ($144.5 million)
- Moffat ($140 million)
-
Curiously Moffat itself was not one of those, having dropped to $80 million revenue. Their 2010 result was just an estimate, so possibly an overestimate? ↩︎
-
Livestock Improvement Corporation, Wikipedia. ↩︎
-
NZ’s Transaction Services sells majority stake in $1b deal, NZ Herald. ↩︎
Related Essays
Building An Ecosystem
How can we build an ecosystem of innovative technology startups in New Zealand?
Picking Winners
Imagine objectively selecting companies to receive government support, without the bureaucrats or consultants?
People, People, People
Ask the best startups what’s holding them back and they all point to the challenges of finding and keeping great people.