The key number that we need to calculate in order to diagnose your SaaS business model is average tenure, or, if you prefer, the life expectancy of a new customer when they subscribe to your service.
To calculate the lifetime value of a customer (LTV) you just need to know how much you earn on average from them each month (ARPU), how much it costs you on average to acquire a new customer (CAC), how much it costs you on average to service a new customer (CTS) and how long you can expect them to remain a customer (Tenure). ARPU, CAC and CTS are all easily derived from your financial statements. But, tenure is not so straight forward.
The way this is typically calculated is using the current churn level, which is the rate at which existing customers currently cancel:
Churn = Cancelled Subscriptions / Total Subscribers
For example, if you have 500 subscribers and 12 cancel during the month, then your churn rate is 2.4% per month.
Then:
Tenure = 1 / Churn
For example, if your churn rate is 2.4% then your average tenure using this formula is just under 42 months (or 3.5 years).
This sort of makes sense: if you have 12 cancellations every month then after 42 months all 500 subscribers will have cancelled.
However, in practice this approach often ends up over estimating the actual tenure, as Jason Cohen (aka A Smart Bear) explains in his great blog post on this topic:
“It’s impossible to see ahead to timeframes beyond a few years for a young company and perhaps 4-6 years for a mature one. In those timescales you expect drastic changes in market conditions — a strong new competitor appears or dies, the economy slumps or soars, a disruptive technology changes the landscape, etc.
That in turn will cause material changes in pricing, retention rates, reorganized customer segmentation, usage levels, service levels, and so forth.
Computing expected months with the ad infinitum approach leads you to over-estimate the total revenue you can depend on.
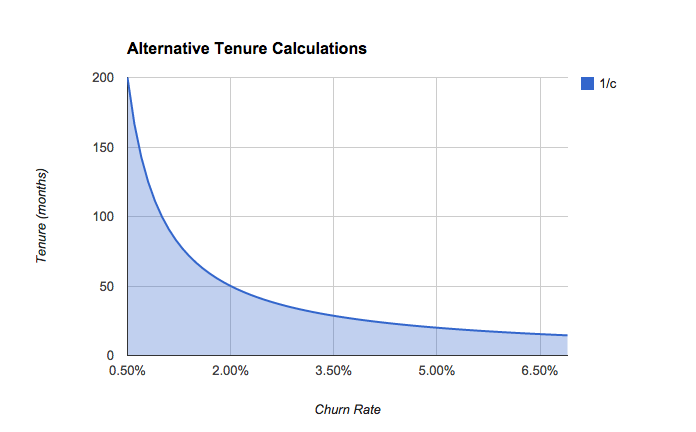
This skew is especially evident if your churn rate is low as the inverse value increases rapidly at this point:

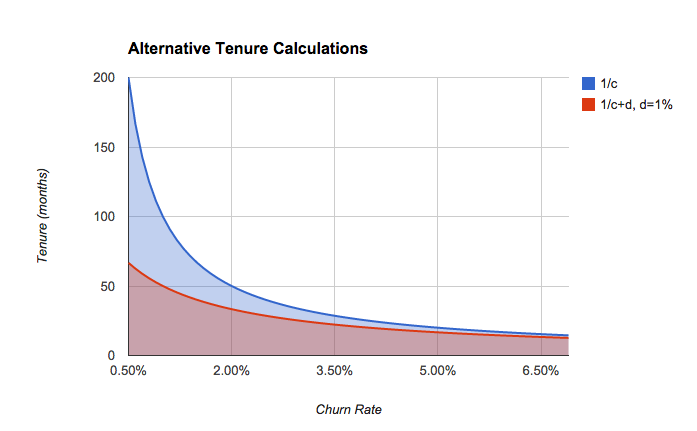
So, what to do about this? Jason suggests two alternative approaches - either capping the number of months or using a discount rate.
Tenure = 1 / (Churn + Discount)
This option does product lower estimates of churn when the churn rate is low (and as he points out who cares about what it does if the churn rate is very high, as in that case you likely have much greater problems to deal with than what tenure formula to use!)

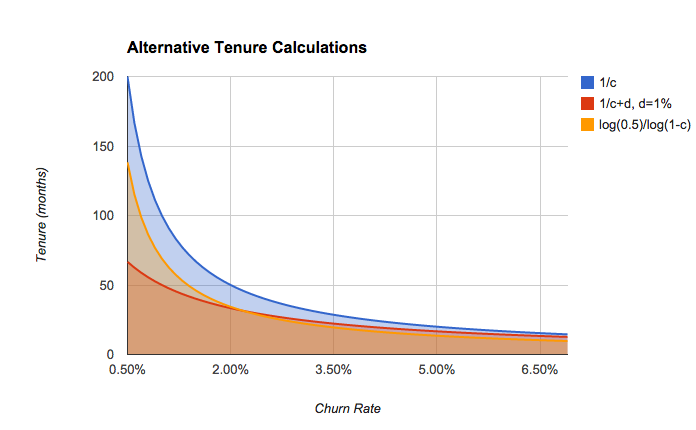
In Dr SaaS we use a third option which gives values somewhere between these two extremes when the churn rate is less than 2%, but lower values when the churn rate is higher.
Tenure = ln(0.5) / ln(1 - Churn)
While this looks complicated, it’s just using the churn rate to work out how many months it takes before half of the new customers in a given cohort have cancelled.
Consider the example above, where tenure is estimated to be 29 months (compared to 42 months for the simple formula):
Month 0: We start with 500 subscribers
Month 1: 500 * 2.4% = 12 cancellations, leaving 488 subscribers
Month 2: 488 * 2.4% = 12 cancellations, leaving 476 subscribers
Month 3: 476 * 2.4% = 11 cancellations, leaving 465 subscribers
Month 4: 465 * 2.4% = 11 cancellations, leaving 454 subscribers
…
Month 28: 259 * 2.4% = 6 cancellations, leaving 253 subscribers
Month 29: 253 * 2.4% = 6 cancellations, leaving 247 subscribers
At this point, 50% of our original 500 subscribers remain, so we take this as our average tenure.
You can see how this looks on the graph:

How are you currently calculating tenure? How does it change your results if you use this formula instead?
I’m interested to hear any suggestions.
