Here is a story…
Two feijoa growers were chatting at a weekend market.
One of them was selling bags of fruit from the back of his truck, and had a long queue of people waiting to buy some.
But he wasn’t happy.
He complained to his friend, “I’m selling lots of feijoas, but I just don’t seem to be making any money”.
“Well”, said his friend eager to help, “how much does it cost you to grow a bag’s worth of feijoas?”
“$4”, said the first farmer, as he took another order from a happy customer.
“How much are you selling the bags for?”
“$3”, said the first farmer, with a proud smile.
“Oh, I know your problem”, said his friend, “you need to get a bigger truck!”
Unit economics
It’s easy to mock the grower in this story. Who would be that naïve, right?
Actually unit economics like this are very common, especially when we are growing fast, where building and sustaining momentum requires us to be investing ahead of our growth. Growth hurts (but only at first).1
For traditional businesses profitability is reasonably straightforward. The revenue and costs of goods sold are obvious when a sale is made. Calculating the cost of acquiring a customer just involves dividing the amount spent on sales and marketing by the number of sales made. The feedback loops are short.
However, for a SaaS business, where customers are paying a monthly or annual subscription, it’s more complicated. In order to calculate the revenue from a new customer, we need to know not only how much they pay, but also estimate (often guess) how long they are likely to remain a customer. Likewise, to determine what it costs to provide the service, we need to consider the total costs we incur over the whole time they will remain a customer.
Keeping on top of the maths can be difficult. The calculations are confusing, it’s hard to even find a consistent formula to use, and a lot of instructions are dense and academic. Plus there is a long list of metrics to calculate. This makes it challenging to know the true health of the business.
So let’s try to make it easier…
To understand our unit economics we just need to answer three questions about our business:
- How much does each customer pay?
- What does it cost to provide the product or service?
- What does it cost to get a new customer?
Lifetime Revenue
To calculare the average revenue per subscriber we take the total revenue earned in the period and divide the total number of subscribers. If we’re growing really fast then we might want to be a bit more savvy about the number of subscribers, otherwise we can just use the number we had at the start or end of the period.
Average Revenue Per Subscriber (ARPU) = Revenue / Number of Subscribers
The average tenure of a subscriber is much more complicated, because it requires us to estimate churn as part of considering how long, on average, each subscriber will remain a customer. In the most simple case, average tenure is the inverse of our current churn rate.2
Average Tenure = 1 / Churn
Once we have those two values we can estimate the lifetime value of a subscriber: 3
Lifetime Revenue = ARPU * Average Tenure
It’s difficult to predict future events like repeat purchases or churn, so these calculations are often inaccurate. We could limit the time horizon to something that we have more confidence in - i.e. rather than estimating lifetime revenue we can use expected revenue over the next year.
Annual Contract Value (ACV) = ARPU * 12
Another option is to use the length of our runway - i.e. how much do we expect the revenue from each customer to be before we run out of cash?
Cost of Service (CTS)
We need to consider all of the costs associated with providing our service. These include some direct expenses (e.g. payment processing costs), website hosting costs, tools (e.g. customer support platforms) and staff costs for the customer support and infrastructure teams.
CTS = (Total Cost of Service / Number of Subscribers) * Average Tenure
Based on that, we can calculate the lifetime value of a customer:
Lifetime Value (LTV) = Revenue - CTS
(This is sometimes abbreviated as COGS, for “Cost of Goods Sold”.)
Cost of Acquisition (CAC)
We also need to consider all of the costs associated with sales and marketing. These include some direct expenses (e.g. advertising costs), tools (e.g. salesforce automation platforms) and staff costs for the sales and marketing teams. Depending on the approach to sales, sometimes individually-negotiated discounts or promotions are also included as a cost of acquisition.
CAC = Total Cost of Acquisition / Number of New Subscribers Acquired
Gross Profits
With those three numbers, we can calculate our gross profit and margins on a per customer basis:
Gross Profit = Revenue - (CTS + CAC)
Gross Margin = Gross Profit / Revenue
If we prefer a picture, graphing these values like this is a nice way of visualising the various components:
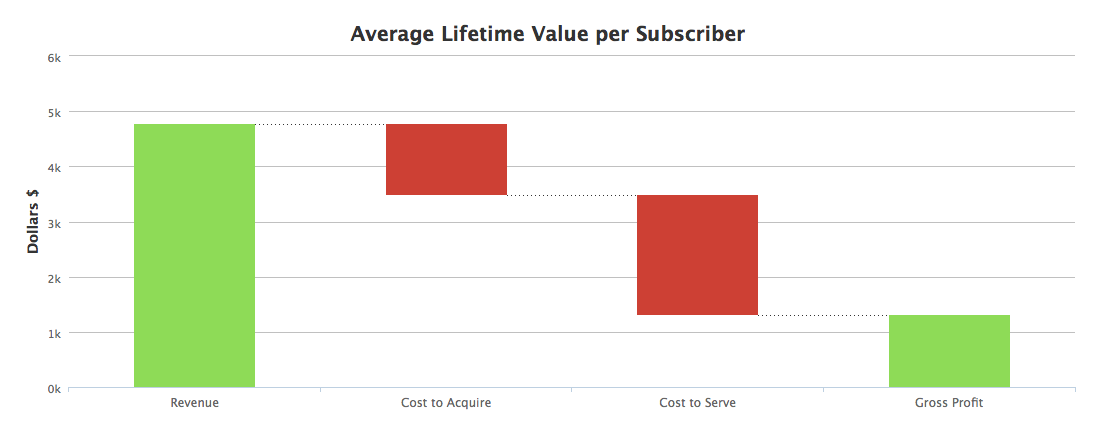
It’s important to note, the gross profit is not always positive. If the amount we spend on acquisition is greater than our revenue then we may make a loss on a per customer basis. We’re effectively selling $4 bags of feijoas for $3!
We can also calculate one of the most common ratios for a SaaS business model:
CAC:LTV = CAC / LTV
Ideally the value of this ratio is 3+.
It depends how stable and predictable our churn rate is, because both LTV and CTS depend so heavily on our estimate of tenure.
An alternative measure, that takes churn out of the equation, is to calculate the payback period (i.e. the number of months that it will take to earn back the average acquisition cost) or use the annual value rather than lifetime value as the denominator in the equation.
Payback Period = CAC / ARPU
CAC:ACV = CAC / (ARPU * 12)
Common problems
There are a number of problems with these calculations:
Small team
When there is only one person or a small team covering multiple areas of the business, it’s difficult, if not impossible, to split staff costs into the different areas. For example, until we have a separate sales and support team then it probably doesn’t teach us much to calculate separate CTS and CAC values.
Small customer base
When we only have a small number of customers even little changes can make a big difference. For example, it likely doesn’t make sense to calculate a CAC value if we only have a handful of new customers per month or if sales are lumpy rather than consistent.
Volatile churn rates
Likewise, a small customer base often leads to volatile churn rates. Some months we may have a large number of customers churn, and other months we may have none at all (and all of these calculations break if our churn rate is 0%!)
One remedy is to calculate the churn over a longer time frame - i.e. a rolling three-month churn rate - so that spikes in one particular month are averaged out. However, when we do this it makes an already lagging indicator even more lagging.
Economies of scale
When our customer base is small it can distort some of the cost components included in these calculations. For example, costs like fixed payment processing, rent (if we apportion this to teams as part of these calculations) or hosting and tooling will have better economies of scale if/when we’re bigger.
Known unknowns
When we first start spending on sales and marketing it’s very common for the results to be all across the spectrum. Some of our experiments will be very fruitful and some will be complete flops. While we’re in that mode our CAC is likely to be very unflattering. The important thing is to make sure we’re not just flailing. We can do this by looking at the trends over time - in theory our CAC should reduce as we understand what works (and do that more), and what doesn’t (and do that less).
Customer success
It’s increasingly common to have people focussed on customer success, distinct from sales or support. But where do we include that team in these calculations? Are they part of the sales team (i.e. onboarding new customers is an important part of converting potential customers into subscribers) or are they part of the customer support team (i.e. ensuring customers are successful is an important part of creating happy customers that don’t churn)?
Ultimately it doesn’t matter to the overall gross profit calculation, provided we include the costs somewhere, however from experience, expect some robust debate internally about which metric should capture these costs.
Extra for experts
Once we’ve understood our unit economics, and are more confident that we’re making money on a per-customer basis, the next level up is to set our sights on profitability.
There are two additional questions:
- How many customers are needed to cover our fixed costs? (the break-even point)
- How much cash do we need to get to that point? (the capital required)
Here we need to consider all of our fixed costs (sometimes called overheads), including all the tools and staff costs that are not captured above - i.e. the cost of our product development and admin teams etc.
Customer Target = Fixed Costs / Gross Profit Per Subscriber
This gives us a snapshot in time, based on current costs, but it’s also useful to think ahead to what these costs are likely to be in the future when calculating this number.
Finally we need to ask how much we need to invest before we get to the point where the per-customer profits are covering all of the costs of the business, and how we’re going to fund that gap. Perhaps we can bootstrap by reinvesting cashflow into growth, or perhaps we’re planning to raise investment. Either way, being able to draw our cash curve will help us continue with confidence that we have sufficient runway.
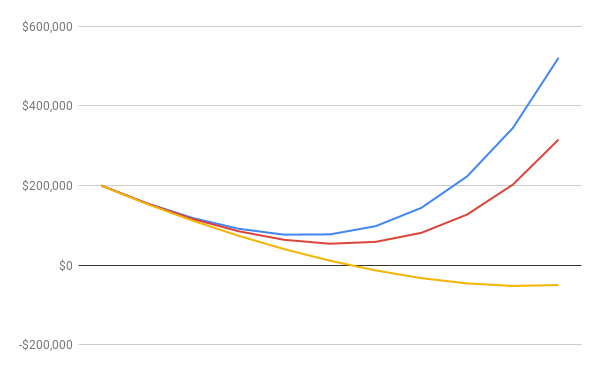
This example shows three alternative cash curves.
The only variable is the churn rate: Blue=2%, Red=4%, Yellow=8%
Please don’t be like the feijoa grower, losing $1 on every customer and attempting to solve this by investing in larger and larger trucks to take more and more product to market. As we grow, we need to take the time to understand our unit economics, and constantly ask: with the current business model, where is the biggest opportunity for improvement?
In the long run we win by making something so great that people will pay more for it than it costs us to make.
-
SaaS Valuation Primer, Andressen Horowitz, 13th May 2014. ↩︎
-
See also Estimating Tenure for some more complex approaches to calculating this value. ↩︎
-
It’s important to emphasise the “estimate” here. See: What’s your true LTV? by David Skok and Estimating Tenure. ↩︎
Related Essays
Flailing
Here is some unusual advice for people working on a startup, or thinking about it: swim.
M3: The Metrics Maturity Model
Use these simple steps to improve how we measure and report our progress.
Buy the book