Just over a year ago I started using an iPhone app called Fat Watch to track my weight and body fat percentage every day. It’s had a big effect.
This might be the most no-nonsense, accurately described app in the store, but probably doesn’t have the viral coefficient that it might have with a slightly less direct name - it can be difficult to find the right words to use when you want to recommend this app to your friends. But, let me try. 🙂
It was, at the time and still, the most expensive app I’ve purchased for my iPhone, at NZ$13.99 (since then the price has dropped to $9.99), but still good value I think.
A brief history:
Between 2001, when I peaked at 106kg, and 2004, when I returned to NZ from the UK, I lost about 25kg. Mostly this was a result of eating less crappy food, but also by being more active.
In the five years following I more-or-less maintained my weight at between 82kg and 85kg, although during that time I started to train more consistently for cycling and triathlon and in the process shifted my body composition quite a bit, from ~23.5% body fat to just over 20% body fat.
To be honest, I was focussed more on my aerobic fitness than on my weight. We didn’t even own scales, although I did weigh myself from time to time at the gym. I mostly measured my progress using the belt on my trousers. I thought I’d pretty much lost as much as I was going to and was confident that I wouldn’t fall back into old bad habits and put it back on.
However, despite all of the good things I was doing there was a persistent amount of body fat that I just couldn’t shake, especially on my upper body. Then at the start of 2009 I broke out of the top end of this weight band, so I decided it was time to start paying more attention and seeing what changes I could make. When I first installed the app and weighed myself in May 2009 I was 88.6kg.
Measure Everything
My first goal was to get back to 80kg. Even when I was running fit in London I never got below this level. I guess I assumed that this was my asymptotic limit. I was wrong.
Since I started measuring, as the graph below shows, I’ve lost about 15kg, and skipped right through the 80kg barrier. As I type I’m about 73.5kg.
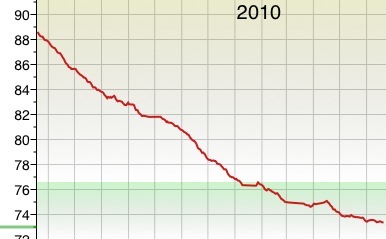
The red line is a moving average of daily measurements, taken at approximately the same time each day using the approach described in The Hackers’ Diet. You can see there have been a few flat points, which all correspond to times when I’ve been traveling. But, in general, it has fallen reasonably steadily during this time.
The green shaded area is the “normal” range based on the BMI scale. I remember calculating this when I weighed ~90kg and thinking it was absurd to think that 76.5kg was my target weight. I’ve now been comfortably below that level for a few months.
When you aggregate these changes over a long period of time they seem quite big, but actually they are small. Over the last 12 months I’ve lost about 0.25kg per week. If you do the maths (or let the app do it for you!) on average I have been burning ~277 calories per day more than I have consumed - less than one Moro Bar - not such a big sacrifice when you compare it to the positive effect that it has had.
Feedback Loops
In physics they talk about an Observer Effect - that is, when you observe something you will change it. This is how I think of these changes. It’s all about creating a feedback loop between what you do (inputs) and the effect it has on you (outputs); creating a game that you win by following the behaviours that you want; and getting a much better understanding of the impact of all of the little decisions you make.
If you eat an unnecessarily big lunch and weigh yourself a couple of weeks later it will be difficult to create a cause and effect relationship, but when you weigh yourself the next day and can compare that to previous days and see the increase immediately then you can start to work out what not to do. Or, perhaps even more importantly, if you know that you’re going to weigh yourself the next morning and be disappointed in the results then perhaps you choose a better option from the menu or eat a smaller portion in the first place.
When you measure your weight every day you also get to see how much it jumps around of its own accord. This graph from the last three months shows the daily readings in black.
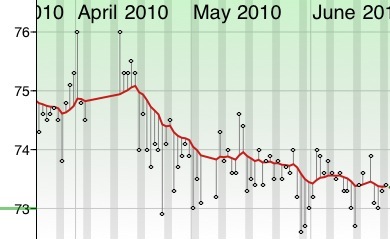
Again, the red line is a moving average. You can see there are many days when I was 1kg or more above or below the trend line. There is generally an explanation - too many snacks or not getting enough sleep (bad) or a long bike ride or hard session at the gym (good). There is only one way to learn about all of these different factors.
You also see the importance of taking regular and consistent measurements, so as not to be unnecessarily disappointed or unrealistically encouraged by a single reading in isolation.
In mid-April there was an updated version of the app released which added tracking for body fat percentages. This can be difficult to measure accurately using scales, but again using regular measurements and a moving average you will at least get a sense of the trend. This graph shows my total body fat measurement over the same period.
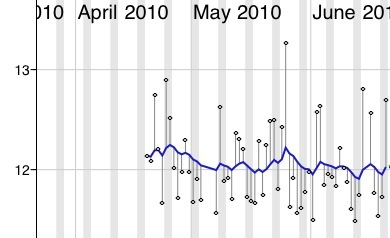
According to ACE an “ideal” range for a fit male is between 14% and 17% (at the moment between 10.3kg and 12.5kg for me), so I’m now in that range, and probably only have at most ~2kg more to lose.
What am I going to obsess about then, I wonder?
Related:
Replete - my previous post about weight loss
“If you want to be healthier or lose some weight it’s very easy to complicate things. But, in my experience at least, it’s mostly the simple things you already know you should or shouldn’t do which make the biggest difference.”
Fat In A Can - NYC Health (via @presentationzen)
“1x can of soft drink per day = 4.5kg fatter per year”
One Tasty Pie Chart - DataVisualisation.ch
This is a bit of a gimmick - but still an interesting concept. If you’re trying to reduce the portions you eat then one easy solution is a smaller plate.
Exercise, weight loss and common sense sensationalism - Science of Sport
An excellent series of posts.
“This market is enormous, a multi-billion dollar industry, and it borrows from science to pitch a dizzying array of exercise machines, programmes and diet plans at consumers, who, desperate for an answer (in a short space of time) will jump at anything that promises to meet their need.”
Withings - WiFi enabled body scale
If the hassle of data entry is the main thing stopping you from tracking your weight then perhaps you’re lacking some of the core motivation required to sustain something like this, however, this is nifty technology.
Everything you know about muscle is wrong - Men’s Health
This is probably a lot more than you wanted to know about muscle. I recommend you try the knee life experiment he talks about - a useful reminder that your body is something you can maipulate.
“Every move you make is a physical experiment. If the experiment works — say, you swish a jumper while cocking your head to the side — it becomes a habit. All those little habits become locked in as posture. Over time, posture becomes structure: The man who accidentally nailed a three while his ear was itchy now feels comfortable only when his head is slightly off kilter.”